


Aug 03, 2022
5 Questions to Ask Yourself When Making Data Visualizations

Written by Angela Alburei
Category:
Data & Analytics

Using data visualizations is a tried-and-true practice when presenting information. They help you capture the attention of your audience, prove your point, and increase understanding of the information you are sharing. Cornell University found that if a scientific claim is presented in pure words or numbers, 68% of people will believe that the information is accurate and truthful. But if you put a simple graph with the claim, the number rises to 97%.
Often times, however, determining which type of visualization to use, how to present it, and how to create it, can be a stumbling block for organizations. By asking the right questions, you will be able to best determine which visual will help you reach your goals.
Graphs can be a great visual, but you should consider if this option is the best way to showcase your data or if you should consider an alternative. Think first about what your biggest takeaway is going to be. If you are showing off a trend, multiple comparisons, or time series, then a graph is a great option for you. However, don’t discount the impactful usages of simple data tables or emboldened numbers on a slide. Sometimes, all you need is a well emphasized statistic to get your point across. Data visualizations are only one tool in your bag of tricks as an analyst. Knowing the right time to use them is fundamental to your message’s clarity.
Now that you know which visualization is the best format for presenting your data, you should determine how your audience will be introduced to it. There are two formats commonly used – live presentations and handouts.
Live Presentations
Handouts
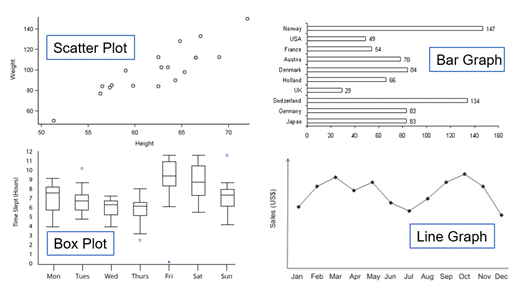
With an abundance of data visualization programs and customizations, it can be tough to pinpoint which type to choose for your data. Thankfully, there are ways to hone your selection depending on the relationship your data represents. Of your choices you will be primarily utilizing one of four options – the scatter plot, bar graph, box plot, or line graph.
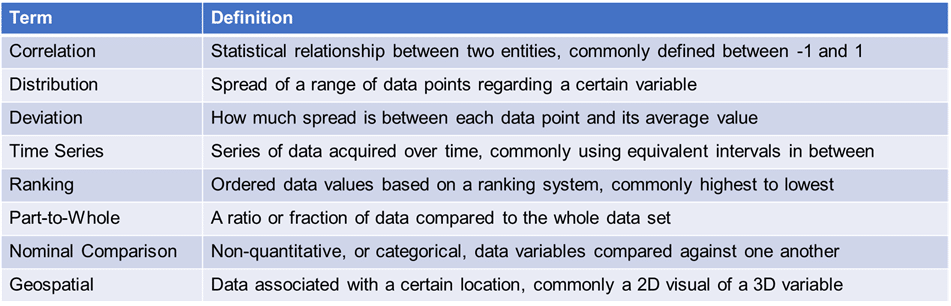
There are also several relationships you will be asked to represent. Below are the terms and definitions for a handful of common relationships.
Scatter Plots are best used for distribution, correlation, and geospatial relationships.
Line Graphs are best used for time series, deviation, and distribution relationships. They should never be used for nominal comparison relationships.
Bar Graphs are best used for ranking, part-to-whole, deviation, distribution, and nominal comparison relationships.
Box Plots are best used for distribution relationships. They should never be used for correlation, geospatial, or nominal comparison relationships.
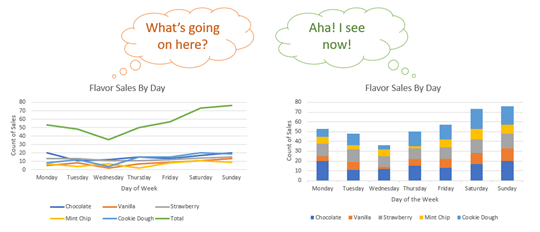
You will notice that some relationships can be well defined using multiple types of graphs. In this case, always choose what is simpler for your audience to understand. Consider making both graph or plot options the same size and compare which is easier to read. You can test this by having a colleague outside of your team look at it. There are exceptions to these rules, but they can guide you on your journey to being an amazing data visual producer.
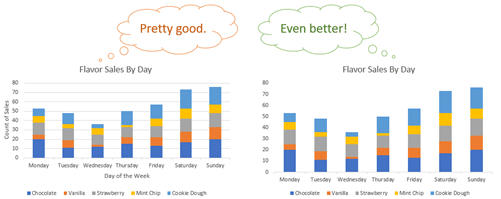
It may seem counterintuitive to discuss deletions during the creation process, but this question can help you pack the best punch into the data visualization you choose. Rather than fear empty space in your graph, embrace it as a form of emphasis. Just as a dramatic pause can bring attention to a part of a speech, white space on a graph can cast attention to your big takeaway. Data visualizations are meant to wipe away the confusion of data interpretation and only leave what really matters. Use affordances that are intuitive enough to be understood without additional explanation. Our brains are awesome at filling in patterns and interpreting symbols. Delete simple labels, remove distracting gridlines, and unify your axes when possible. Less is more when it comes to data visualizations.
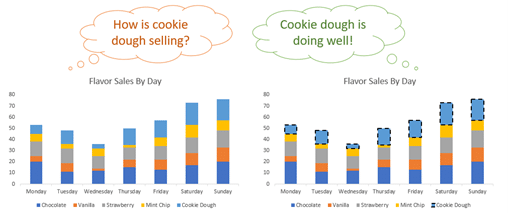
Pre-attentive attributes are an analyst’s best friend. Simply put, they are ways of pulling our audience’s eyes to the right spot. There are many options – a bright color, larger size, thick outline, extra space, or short underline can make all the difference in whether your audience safely arrives to your message or gets lost in an avalanche of numbers. This is because pre-attentive attributes appeal to our iconic memory – the type of memory we use to quickly identify graphical information. Be careful not to overuse them though. Too many pre-attentive attributes will become distracting rather quickly. Just as you would not apply highlighter to a whole textbook, only add the flair of pre-attentive attributes to your most important information.
Citation
Knaflic, C. N. (2015). Storytelling with Data: A Data Visualization Guide for Business Professionals. John Wiley & Sons, Inc.
Headquarters
400 E. Diehl Road
Suite 190
Naperville, IL 60563
Downtown Chicago Office
980 N. Michigan Avenue
Suite 1998
Chicago, IL 60611
Phone
1-800-680-7570