


Jan 05, 2024
Keys to Releasing “Hidden Clinical Capacity”

Written by Lisa Bragg
Category:
Clinical Optimization

In today’s market, health systems need to make use of every available hospital bed. Yet for most organizations, there remains a significant amount of “hidden clinical capacity” that is waiting to be unlocked. The key is looking beyond just average length of stay (ALOS) as the barometer for organizational success – and aligning your tactics and strategies with your biggest areas of opportunity. This article outlines steps you can take to unlock hidden clinical capacity, maximizing access to care and improving the financial health of your organization.
When we refer to “unlocking hidden clinical capacity” we are talking about uncovering the bottlenecks creating delays within the process of moving patients in, through, and out of a care facility. These bottlenecks or inefficiencies are waste, and the goal is to minimize them. For example, not getting diagnostic tests done in a timely manner, or waiting a day to reassess a condition, versus doing it later the same afternoon, are unnecessary delays that increase the time the patient is in the care facility and adversely impact the average length of stay (ALOS) metric for the facility. Hospitals use ALOS to measure how efficiently they are operating. Basically, this is the average amount of time a patient spends in the hospital. A shorter stay is better because it means the hospital can serve a higher volume of patients in the community. Therefore, hospitals with high ALOS will look for ways to optimize care delivery and release hidden capacity. The overarching goal is to always provide high quality and safe care while balancing the patient’s length of stay.
For any given patient, there are several processes within their care delivery journey that could be evaluated and optimized. For example, when a patient is put on IV antibiotics, there is a point at which, clinically, it makes sense to move to an oral antibiotic, because the risk of adverse line-related issues increases, among other things including lengthening the patient’s stay. Optimization (unlocking hidden capacity) requires a disciplined examination of patient care each day during their stay. This means working with physicians, case managers, discharge planners, social workers – everyone involved in the progression of care – to align on targets for each condition. Efficiencies can be achieved by manually tracking and adjusting the various sub-metrics for these processes, but this would be exhausting, so instead healthcare organizations typically analyze ALOS to gauge performance.
The problem with measuring performance with averages is you aren’t getting a clear enough picture. For example, according to the Centers for Medicare & Medicaid Services (CMS) the expected geometric mean length of stay (GMLOS) for a patient who receives a tracheotomy without comorbidities is 24.2 days, whereas the expected GMLOS for a patient with heart failure without comorbidities is 2.1 days. If you average the two, you’d get 13.15 days, which for an ALOS looks bad, but in reality, you may have met the geometric target for both. More on this below.
Overall, there are three critical steps for hospitals and health systems to successfully release “hidden clinical capacity.”
Healthcare delivery organizations cannot capitalize on opportunities that they don’t know exist. Successfully identifying hidden capacity requires a deeper analysis than just looking at average length of stay (ALOS). For example, hospitals and health systems also need to account for the acuity of the patient and the expected length of stay for that type of patient. This is usually done by looking at geometric mean length of stay (GMLOS), which is based on a given patient’s diagnosis-related group (DRG) and is useful because it pulls in and narrows outliers in widely fluctuating number sets. GMLOS is what CMS uses to determine Medicare reimbursement.
While ALOS is helpful in understanding high-level capacity and utilization trends at a hospital or health system – and GMLOS underscores the expected ALOS target for reimbursement – relying solely on averages can mask specific areas of opportunity. For example, looking at the difference between ALOS (actual results over time) and GMLOS (expected results over time) can underscore that there is a general need for improvement at a given hospital, but the difference between those two averages will not show exactly where those areas of improvement are.
For this reason, our approach to unlocking hidden capacity focuses on systematically looking at every discharge and measuring how each patient’s LOS compares to the GMLOS target. We specifically isolate the total “excess days” – i.e., any days over the GMLOS target – to uncover underlying drivers behind excess days and the biggest areas of opportunity. For example, are there specific conditions that are disproportionally over GMLOS? Are there certain physician groups with a higher number of excess days than others? Is there an opportunity to better manage LOS for observation patients?
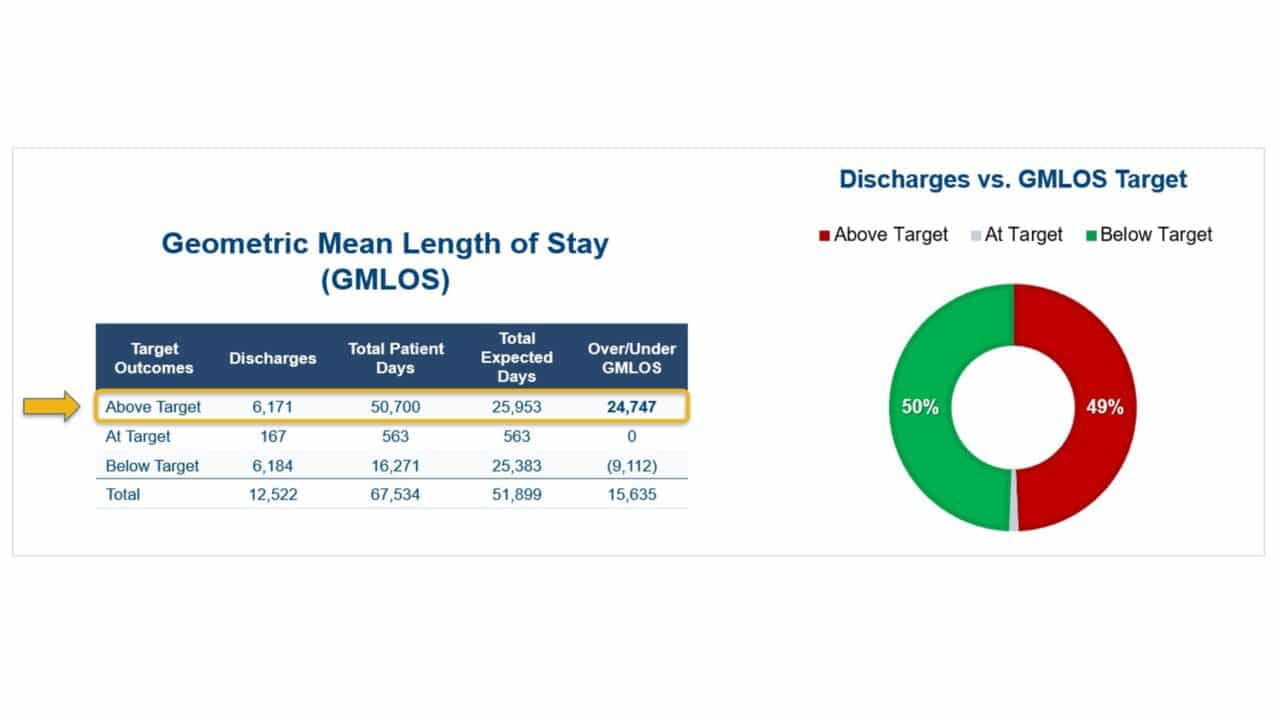
The level of opportunity can be significant. In the de-identified example below, there were 12,522 patient discharges during the measurement period. Fifty percent of those discharges were below the GMLOS target, 49% were above the GMLOS target, and 1% were right at the GMLOS target. On the surface, this may not seem significant given that any average (by nature) is composed of variances. However, the 6,171 “discharges above target” translated into 24,747 excess patient days for this hospital – roughly twice as many as should have been expected for the specific patient population. Assuming the hospital’s goal ALOS is 4.5 days, this means they could have provided care to roughly 2,750 more patients by just “releasing” half of their hidden capacity. And even if the hospital isn’t struggling with capacity constraints, addressing these inefficiencies still represents an opportunity to provide patients more access to necessary hospital care.
Once the key areas (and level) of opportunity to release hidden capacity have been identified, hospitals and health systems are able to develop data-informed strategies to unlock that hidden capacity.
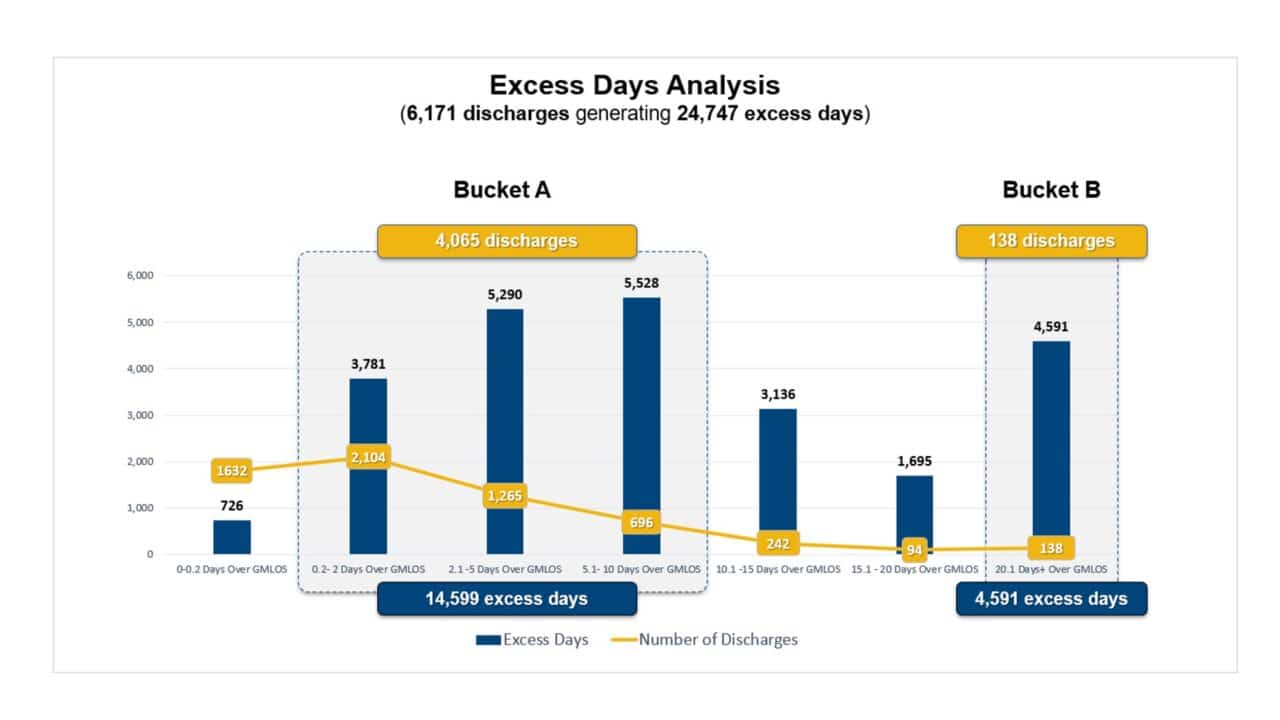
Specific tactics and strategies to address hidden capacity should align closely with the current areas of opportunity. For example, continuing the scenario above, of the 24,747 excess days identified during the measurement period, 60% were from 4,065 discharges between 0.2 to 10 days over GMLOS (see “Bucket A” below). The fact that two-thirds of total “discharges above target” account for so many excess days in Bucket A suggests the hospital is facing diffuse LOS challenges – which are best addressed through a more generalized strategy. At the same time, though, 19% of all excess days were from just 138 discharges that were more than 20 days over GMLOS (see “Bucket B” below). The small number of “discharges over target” that account for the excess days in Bucket B suggest there are also clinically and socially complex LOS challenges at the hospital, which require a more targeted approach. So, in this scenario, a bimodal approach to excess day reduction is needed in order to effectively manage LOS across the hospital organization.
There are a variety of different levers that healthcare delivery organizations can institute depending on the unique areas of opportunity identified and the specific causes of hidden capacity at their organization. For example, one of the tactics that serves as the backbone to our approach is working with the case management team to establish progression of care rounds focused on GMLOS targets.
We also use daily huddles to raise situational awareness, rallying the nursing team around the geometric target for each patient in the unit – and the actions that need to be done that day to achieve the geometric goal. For example, do medications need to be converted from IV to oral? Does the patient need to be ambulated? Are protocols being followed? What should be happening from a discharge planning perspective?
Measuring the impact of the strategies and tactics implemented to release hidden capacity is obviously critical – but just as important is being able to react to that performance. Hospitals and health systems need to be regularly iterating on design to ensure continuous improvement, ideally anchoring performance into technology as much as possible.
Here are a few key performance indicators (KPIs) that hospitals can use to evaluate the impact of such strategies:
Other measures include staff satisfaction surveys, financial metrics, quality of care indicators, such as mortality rates, infection rates, etc., technology utilization, regulatory compliance, and population health metrics.
Regularly collecting and analyzing these metrics will provide a comprehensive understanding of the impact of strategies and tactics to increase clinical capacity in a hospital. It’s essential to establish baseline measurements, set realistic goals, and regularly reassess and adjust strategies based on the data collected. Additionally, considering a combination of leading and lagging indicators will offer a more holistic view of the hospital’s performance.
Hospitals and health systems cannot unlock hidden clinical capacity if they don’t know what is driving the underlying problem. Success requires looking deeper than just ALOS to identify the biggest areas of opportunity, implementing purposeful tactics and strategies that target those areas of opportunity, and then continuing to iterate on design to sustain continuous improvement.
Impact Advisors has the clinical and technical expertise to help widen the front door, improve the continuum of care, and optimize workflows (and automate where appropriate). We listen, respond with empathy, and challenge with respect because we’ve been there. Our clinical experts understand the workflows because they’ve performed them while serving in the same clinical roles. They also know the EHR systems better than most and are backed by the firm’s collective knowledge gleaned over 15 years as the industry’s top EHR implementer.
Learn more about our clinical optimization capabilities.
Five Key Levers that Drive Clinical Capacity Management Transformation
Headquarters
400 E. Diehl Road
Suite 190
Naperville, IL 60563
Downtown Chicago Office
980 N. Michigan Avenue
Suite 1998
Chicago, IL 60611
Phone
1-800-680-7570